Quantitative prediction of K values
 IntroductionFragment modelssp-LFERspp-LFERsComparison of the various methodsPredictive models based on molecular structureCritical remarks on approaches from chemical engineering
 Selftest
 Problems
 Problem 1 Problem 2 Problem 3 Answer Problem 4 Answer Problem 5 Answer Problem 6 Answer Problem 7 Problem 8 Problem 9
Problem 8
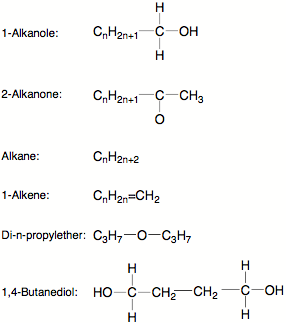
In the figures below you can see experimental data for the equilibrium partitioning of organic compounds from air to two solvents at 25°C (only the regression lines through the measured values are depicted, not the values themselves).
b) What can you say about the differences between the two solvents?
c) Mark where you would expect the experimental values for 1,4-butanediol and di-n-propylether in solvent 2. Explain your choice!
Download this page as a pdf
![]()
![]()