Single-parameter Linear Free Energy Relationships (sp-LFERs)
This modeling approach also uses the regular features found in Figure 1: all compounds from one compound class lie on a straight line.
If we calculate a regression line from 3, 4 or more experimental partition constants for a compound class, then we can use this line for predicting partition constants for other members of the same compound class.
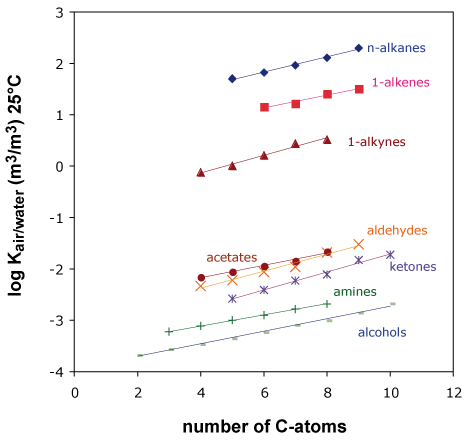
Figure 1
Obviously, this only works if the compounds from a compound class differ by fragments that behave additively. Every compound class requires its own regression and thus its own calibration data. Like the fragment method, this kind of models can be calibrated for all kinds of partition processes between air, water and other phases.
There are a variety of predictor-variables that can be used. Instead of the carbon number used in previous figures one can also use molecular weight or volume of a compound, see Figure 2.
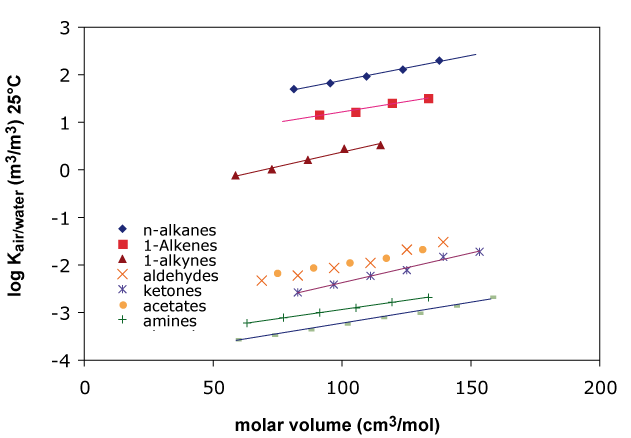
Figure 2
Models based on this type of regression are called Linear Free Energy Relationships (LFERs). They are often used for partitioning into natural organic phases like humic material and biota. But in these cases, octanol partition data of the respective compounds are used as predictor variables instead of molecular weight or carbon number. However, obtaining experimental octanol partition data is quite labor intensive and prone to experimental uncertainty. So, what is the advantage compared to the use of carbon number or molecular weight that are much more readily available?Principally, we can try to use any partition process as predictor for any other partition process. This is demonstrated in Figure 3 where the octanol/air partition constants of various chemicals are plotted against their respective partitioning between hexadecane/air, olive oil/air and ethanediol/air.
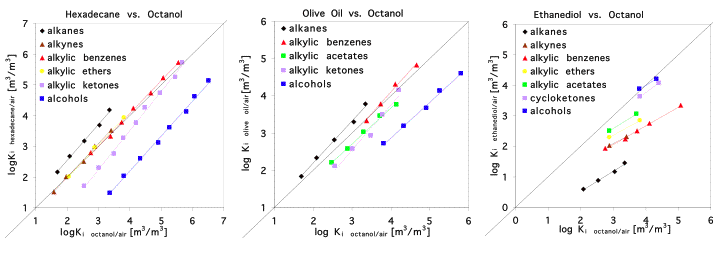
Figure 3
Within a specific compound class we always find a good correlation, but it is obviously not advisable to use the regression for the alkanes in order to predict the partitioning of alcohols in any of the partitioining systems shown here.
However, if we use a partition process as predictor for the partitioning into another, very similar phase, then the regression lines for different compound classes come closer together or even coincide. In this case we may use a single regression line for all compound classes which is very convenient. This is illustrated in Figure 4 for two alcohols: decanol and octanol.
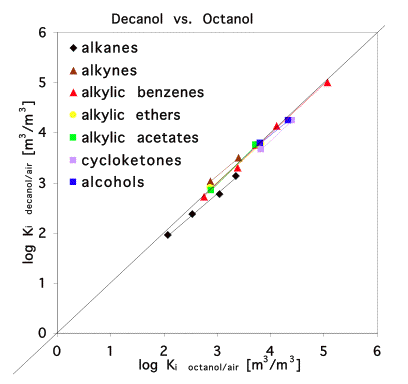
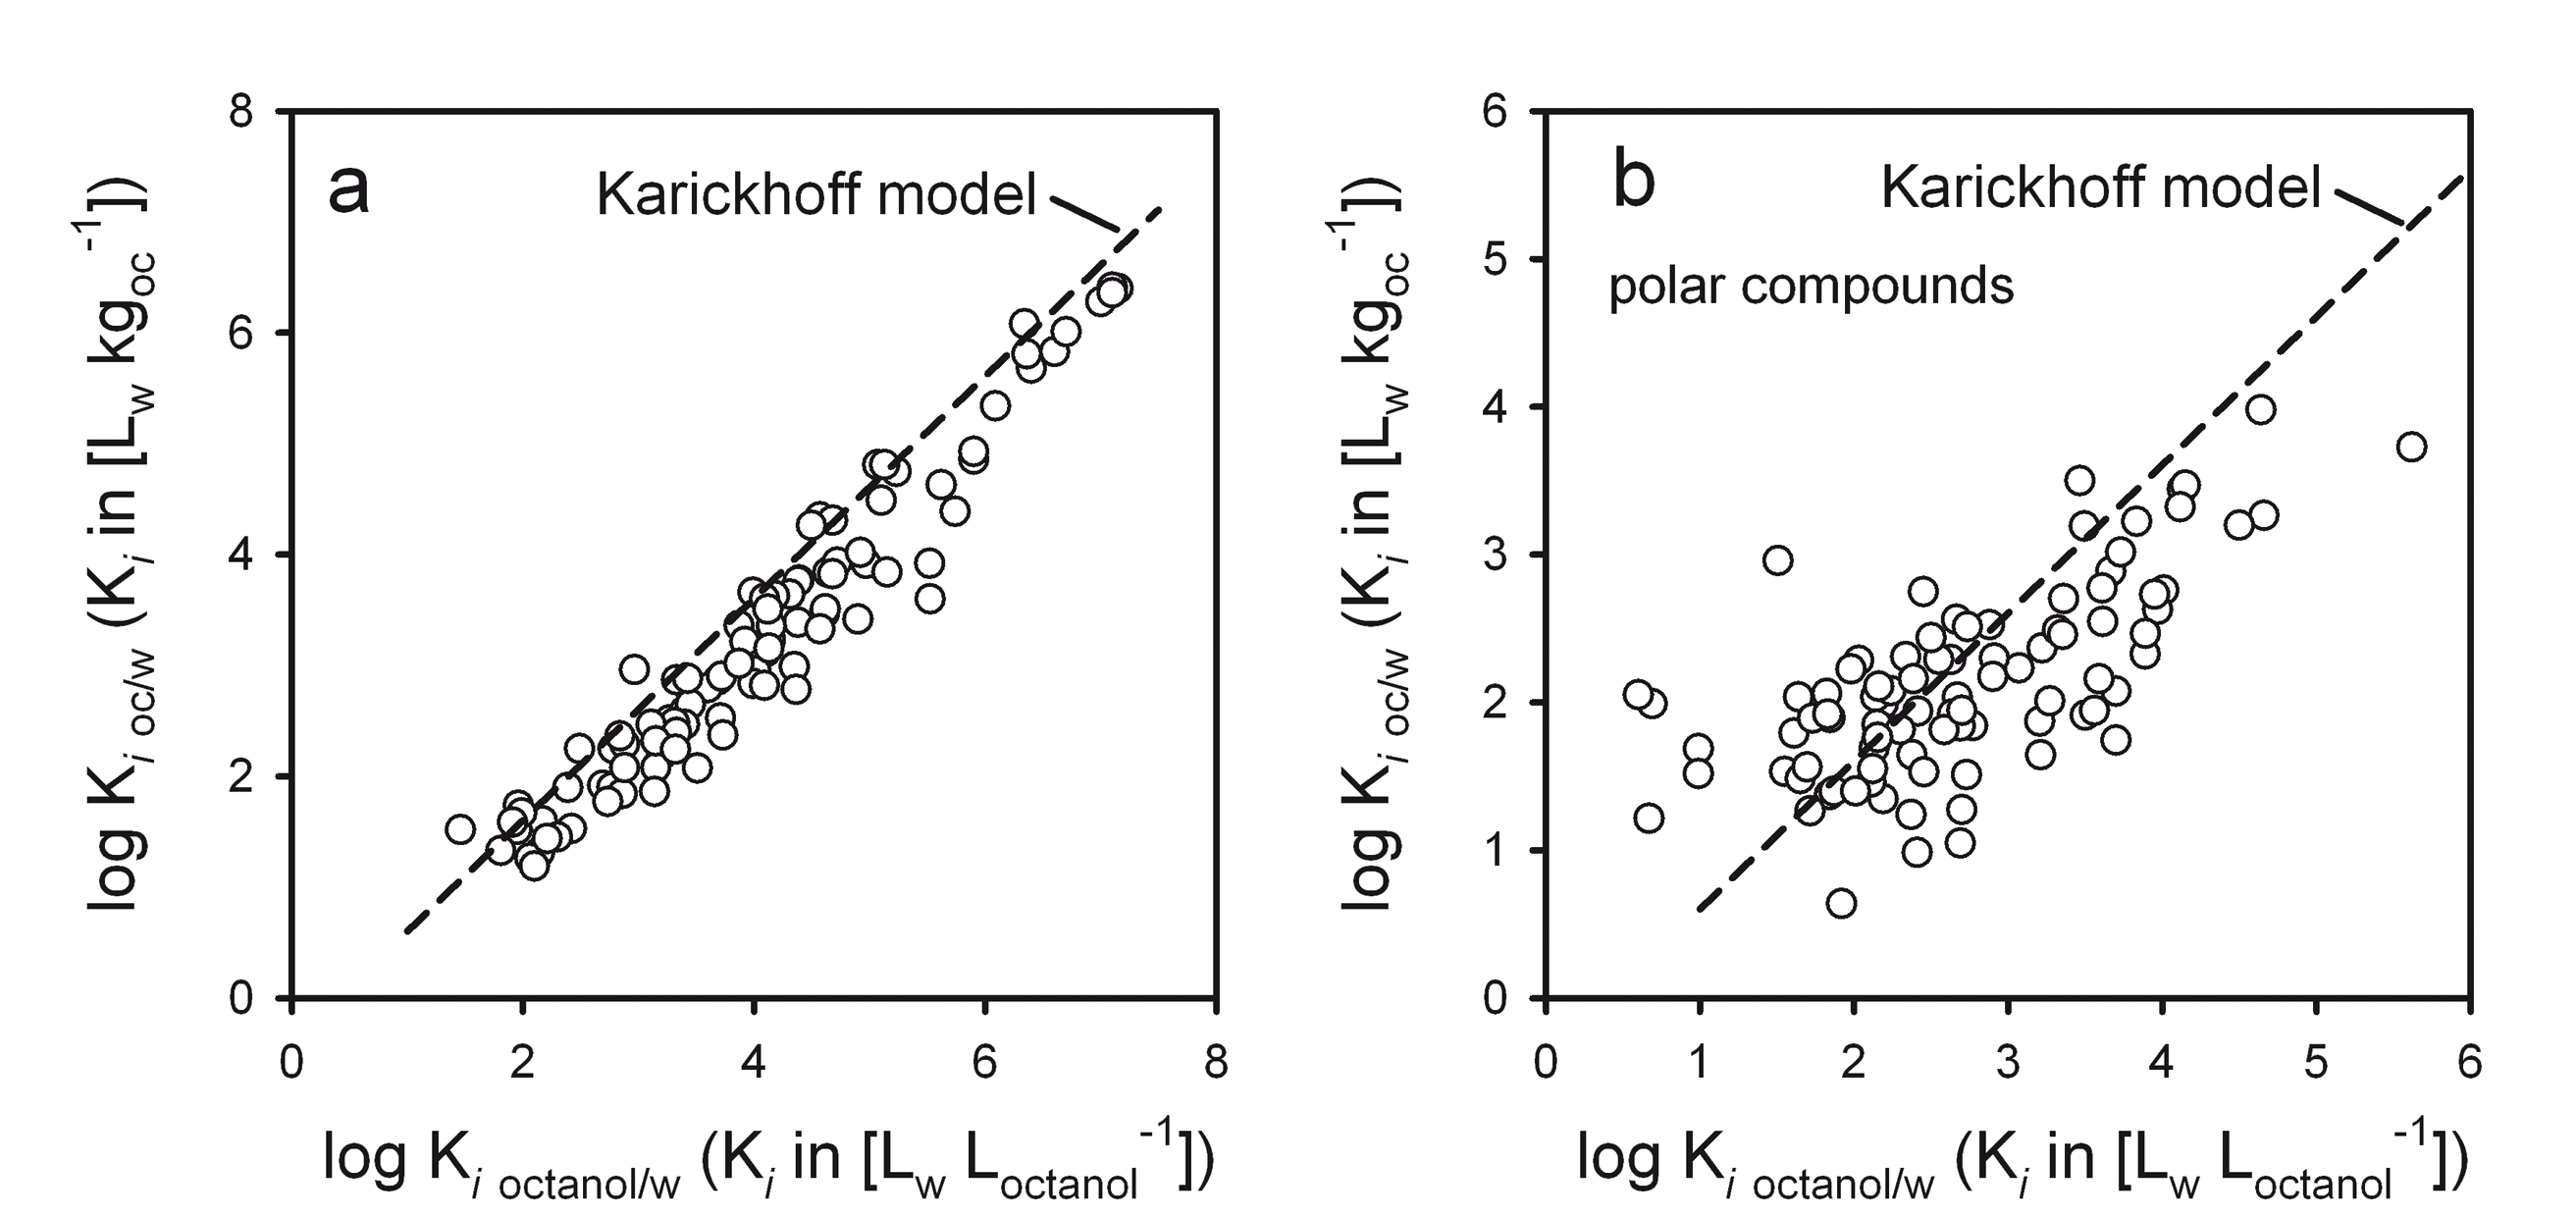
Octanol is a phase of intermediate polarity. Thus, it accidentally happens to be a reasonable model for many complex organic phases like humic matter or biota which explains why it is used so often. It is often overlooked though that the octanol model typically only performs well for non-polar compounds. For polar compounds, correlations with octanol partitioning give no satisfying results. See Figure 5 where octanol is used as model for soil organic matter.
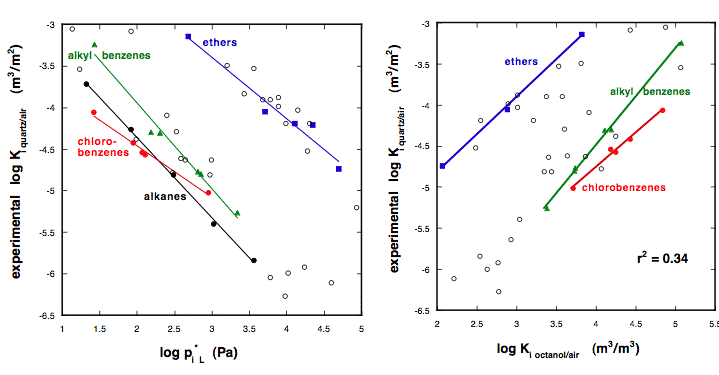
In the past many researchers have often used log linear correlation where no similarity between the compared partition processes was present at all. For example, sorption from air to surfaces is often correlated to the saturated vapor pressure of the compounds or to octanol/air partitioning. The later two processes have very little in common with partitioning between a solid, inorganic surface and air. It is thus not surprising that the regression lines for various compound classes lie far apart (see Figure 6).
In order to overcome the shortcomings of the previous models, it is necessary to follow the approach that has been introduced qualitatively in Chapter 4, i.e. all relevant interaction energies have to be described in separate terms.
Download this page as a pdf

