Quantitative prediction of K values

Introduction

Fragment models
sp-LFERs
pp-LFERs
Comparison of the various methods
Predictive models based on molecular structure

Critical remarks on approaches from chemical engineering

Selftest
Problems
     Problem 1
     Problem 2
     Problem 3
           Answer
     Problem 4
           Answer
     Problem 5
           Answer
     Problem 6
           Answer
     Problem 7
     Problem 8
     Problem 9

Problem 2

a) Why is the order of compound classes in the figure below (from page "Single-parameter Linear Free Energy Relationships") in the plot "ethanediol vs. octanol" almost opposite to the one in "hexadecane vs. olive oil" and "olive oil vs. octanol" (olive oil is an ester)?

b) And why are the slopes so shallow in the "ethanediol vs. octanol" plot?

Your knowledge from Chapter 4 will help you to answer these questions.
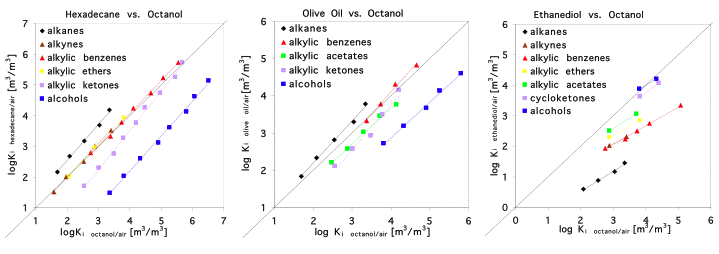
Figure 3


Download this page as a pdf