Equilibrium partitioning of organic compounds
 Some fundamentals ...Summary and further information
 Self test
 Self test: Part 1 Self test: Part 2
  Sorption isotherm Help Answer
 Problems
 Advanced problems
 FAQ
FAQSorption isotherm
Imagine the following experiment. You have a closed bottle with 1 L of water and 50 g soil immersed in the water (no air present). You add a tiny amount of chemical i , shake the bottle until partition equilibrium is attained. You then measure the equilibrium concentrations of i in both phases water and soil.
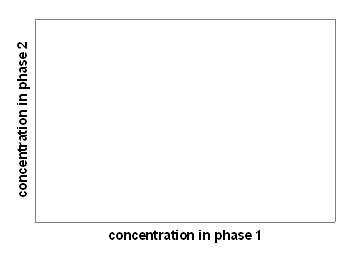
Then you re-add chemical i and, in the following, repeat the steps above. You repeat this 10 more times adding more and more of chemical i . Then you plot the measured data as the concentration in phase 2 (soil) vs. the concentration in phase 1 (water). This plot is referred to as a sorption isotherm:
What will the plotted curve look like? How is the partition constant of i between water and soil related to this curve? What is the maximum concentration that you can reach experimentally? How would the graph look like if i was a volatile compound and the bottle also contained 1 L of air while the experiment was carried out exactly like before?
Download this page as a pdf
| Proceed to help | |